PRECISELY CHARACTERIZING CHANGES IN SURFACE CONDITION OF MATERIAL COMBUSTED IN MICROGRAVITY ENVIRONMENT USING ULTRASONIC IMAGING AND TABLECURVE 3D :
A comparison was made of material specimens before and after microgravity combustion experiments. It was important to characterize the changed surface profile after the burn. These experiments were performed to better understand how flames spread in the microgravity environment such as would be present on the International Space Station. This type of information is critical for safety of astronauts on the Space Station.
We used an ultrasonic imaging technique to acquire precise information about the surface profile before and after the burn. This involved acquiring precise ultrasonic wave time-of-flight data across the entire surface. The time-of-flight measurements (x,y position and time-of-flight (msec)) were converted to surface depression (microns). The experiment was done on the Space Shuttle flight# STS-54. The data was then imported into TableCurve 3D for 3D viewing and data manipulation.
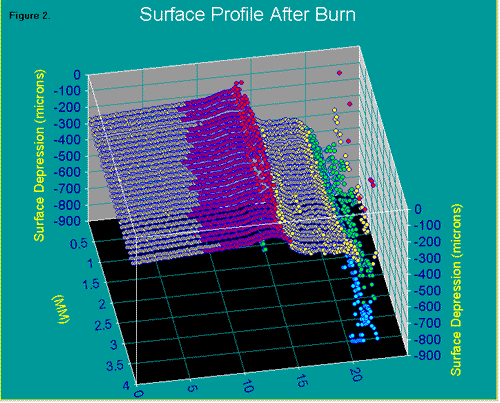
The figures below show the surface height in microns of a plastic sample as a function of x and y position in mm before and after the burn.
|
Figure 1 shows a surface map of a material sample before burning in microgravity environment as it appears in TableCurve 3D. |
The burn front traveled from right-to-left and caused an ~ 1000 um depression initially, followed by a decreasing (ramping) depression, and finally, an actual increase (hump) in the surface before burning out.
The burn profile is significantly different from that seen in a normal gravity environment.
Author : Dr. Don J. Roth, NASA Lewis Research Center.
[ Case studies index ]

